

Console & network log (Rec)
The panel records what the tab under test is doing — console messages and network calls — into a rolling window, and attaches it to a failed result as a readable text file.
Record
Section titled “Record”-
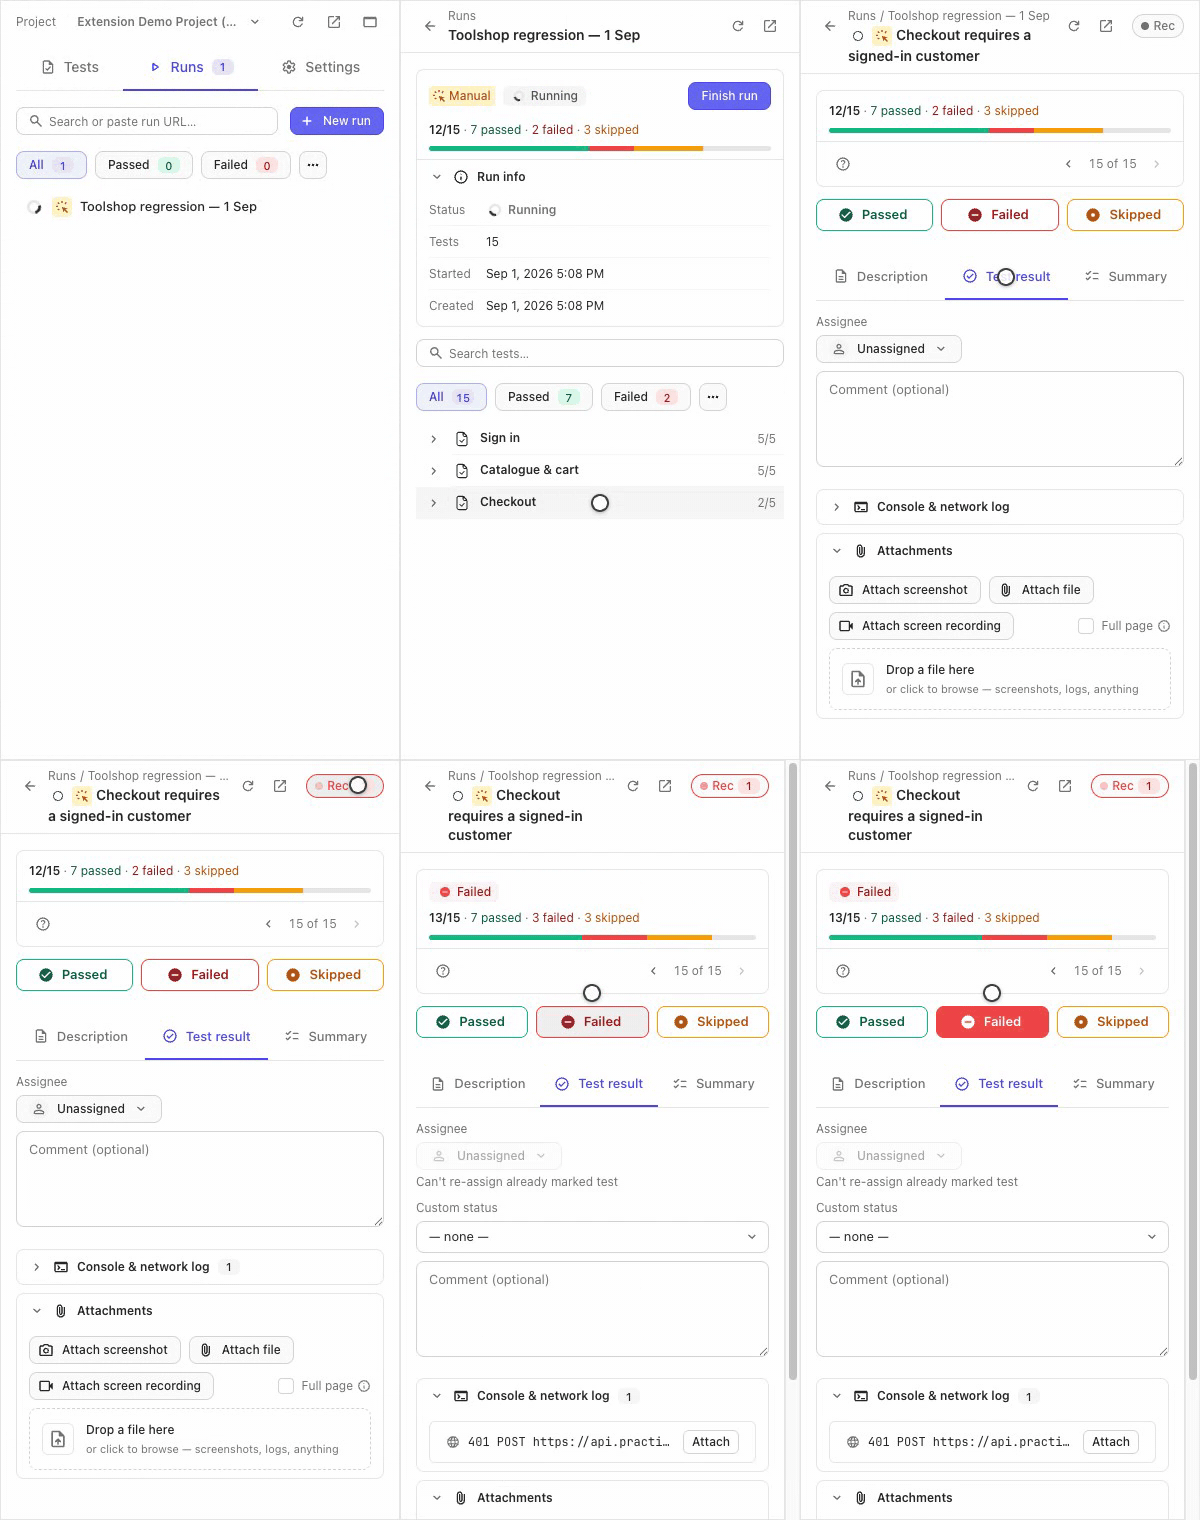
Open the test and press the Rec chip in the panel header. Start it before reproducing the bug, not after: the recorder keeps only the last 60 seconds (the window size is a Settings → Failure log field).
-
Reproduce the problem on the page.
-
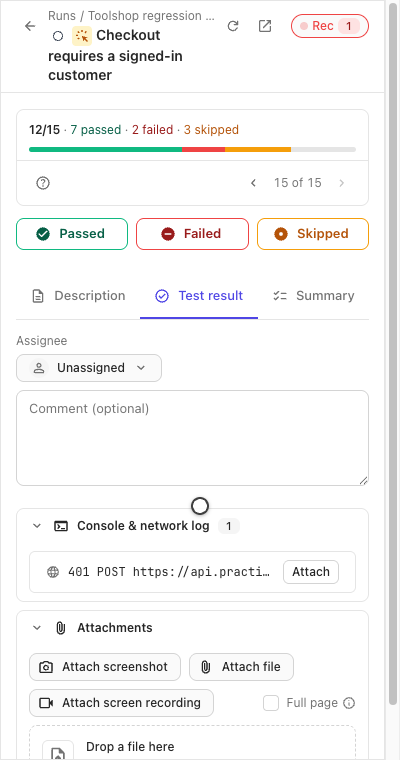
The chip counts errors as they happen, and the Console & network log fold on the test’s result tab reads them inline — a failed request shows its method, URL and status.
The whole pass, live:
Attach
Section titled “Attach”Mark the test Failed — the recorded window uploads by itself as a
.txt with Console and Network sections, and is linked on the result.
That auto-attach is on by default; Settings → Failure log holds the
switches:
- Attach log to failures — the auto-attach itself.
- Include response bodies — bodies are kept for failed requests.
- Record environment info — browser and system context rides along.
- Include the query string — off by default: URLs are logged without their query part, so tokens in parameters stay out of the file.
- Auto-start … when you open a test in a run — arms Rec for you.
- Log window — the seconds the recorder keeps.
If it didn’t work
Section titled “If it didn’t work”- The log is empty — recording started after the bug happened, and the window had already rolled past it. Start Rec first, then reproduce.
- A request you need isn’t there — the recorder binds to the tab it was started on; a bug reproduced in another tab was never seen.
- No log on the result after failing — check Attach log to failures in Settings → Failure log; in basic mode uploads need the full session too.